Working with Stock and Geography Data Types in Excel
Working with Stock and Geography Data Types in Excel
Working with Stock and Geography Data Types in Excel
Microsoft recently added two new data types to Excel – 1) Stock and 2) Geography. If you use Excel 2019 obtained through a perpetual license, or Version 1810 and newer of Excel provided through an Office 365 subscription, you have access to these new tools. With them, you can enter information such as locations or stock ticker symbols into your spreadsheets. Upon doing so, Excel then retrieves relevant information that pertains to that data.
Working with Stock Data Types
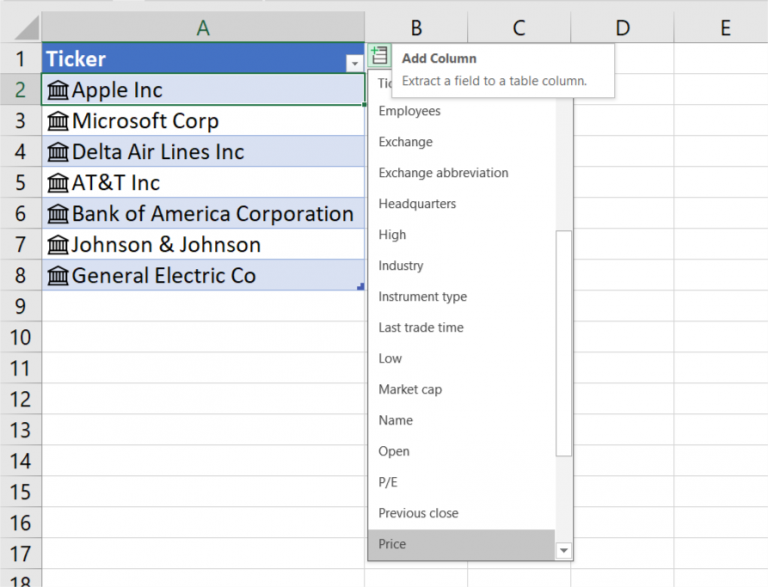
Our first example of using these new data types involves using the Stock data type to retrieve information about a group of stocks. Let’s assume that for each of the stocks represented by the ticker symbols shown in Figure 1, you need to obtain the most recent price and the total market capitalization for that stock. To do this using the new Stock data type, select the ticker symbols and then click Stocks from the Data tab of the Ribbon. Upon doing so, the ticker symbols transform into the names of the companies represented by the symbols, as shown in Figure 2.
Figure 1 - Selected Stocks for Analysis
Figure 2 - Converting Data Points into Stock Data Types
Clicking the icon in the upper, left corner of cell B1 in Figure 2 causes Excel to display a list of stock market and other related information about each of the companies represented. Choosing the Price and Marketcap fields causes Excel to insert the selected data for each company into the worksheet, as shown in Figure 3. Of course, once Excel adds the data to the spreadsheet, you can use it just as if you had entered it directly into the spreadsheet. Further, because Excel links the data, you will see it update periodically as stock market conditions change.
Figure 3 - Stock Market Data Inserted by Using Stock Data Type in Excel
Using Geography Data Types
In our second example of working with the new data types, we will import geographically-oriented data into a worksheet, based on the locations shown in Figure 4.
Figure 4 - Geographical Locations for Consideration
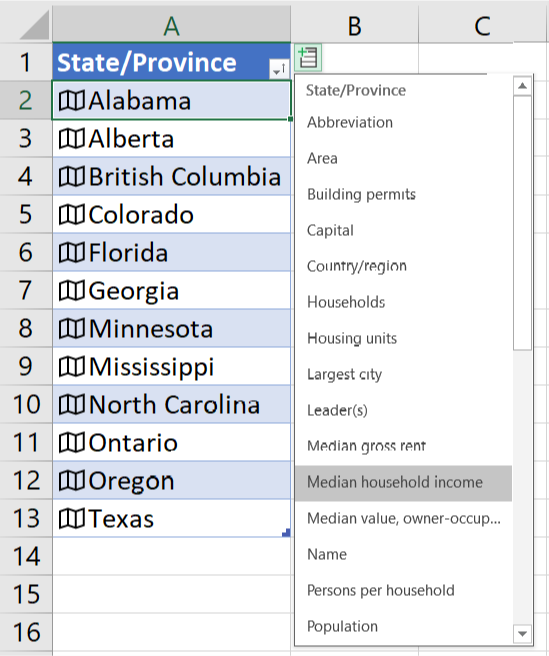
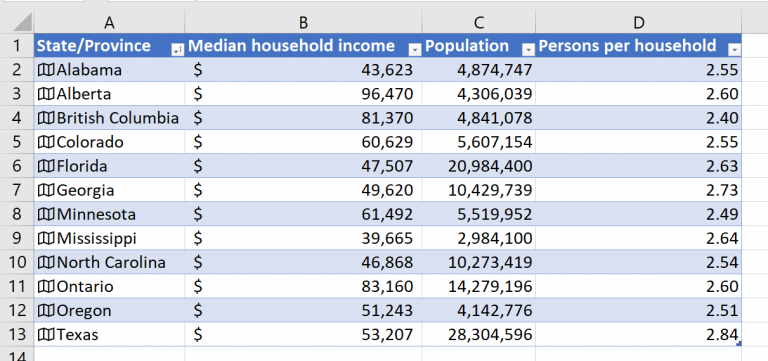
With the locations in the worksheet, clicking Geography from the Data tab of the Ribbon causes Excel to convert the locations into Geography Data Types, as shown in Figure 5. Notice that upon converting the data points, Excel displays a list geographically-oriented data that is available for the data points. In this example, selecting the Median Household Income, Population, and Persons Per Household fields causes Excel to insert the selected data points into the worksheet, as displayed in Figure 6.
Figure 5 - Converting Data Points into Geography Data Type
Figure 6 – Geographically-oriented Data Inserted Using Geography Data Types in Excel
Again, you can use the data brought into Excel using Geography data types just as if you had entered it directly. Because Excel links the data, it updates periodically, provided your computer is connected to the Internet.
Summary
Stock and Geography data types are new features added to Excel. Both these tools provide Excel with Artificial Intelligence capabilities in the sense that they anticipate the type of data you need in your workbooks and help you to retrieve it. As you upgrade into newer versions of Excel that offer Stock and Geography data types, you will want to take advantage of these tools when you are working with those types of data.
You can view a demonstration of working with stock and geography data types by watching the video below.
Facebook
Twitter
LinkedIn
We use cookies to ensure that we give you the best experience on our website. Continuing to use this website acknowledges your consent to our privacy policy.Understood.Privacy policy